

Founders routinely commit eight or ten years of their lives to building a company without ever doing the most basic calculation: what does this company actually need to become for the outcome I want to be possible?
They think in product features, funding rounds and valuation headlines. They rarely think in personal liquidity, ownership at exit, required enterprise value, annual recurring revenue, customer count and unit economics.
That is backwards.
Start with the freedom number
Forget valuation for a moment. The number that matters first is liquid, investable capital: money that is actually yours and can be diversified outside the company.
A simple way to visualize it is to ask what a 5% annual return would produce before taxes, fees and inflation:
- $5 million → $250,000 per year
- $10 million → $500,000 per year
- $20 million → $1 million per year
- $30 million → $1.5 million per year
- $50 million → $2.5 million per year
The important distinction is that a 5% portfolio return is not a guaranteed 5% spending rate. Taxes, inflation, volatility and sequence-of-returns risk all matter. Morningstar's 2026 retirement research, for example, cites a 3.9% starting withdrawal rate for a 30-year inflation-adjusted spending plan under its base assumptions.
The point here is not to pick one perfect percentage. The point is to turn a vague idea of “wealth” into a concrete capital target.
Then calculate the exit you actually need
Now work backwards from the amount you want to own after the company is sold.
If your target is $20 million of gross proceeds, the exit you need depends entirely on what percentage of the company you own at the end:
- 10% ownership → $200 million exit
- 15% ownership → about $133 million exit
- 20% ownership → $100 million exit
- 25% ownership → $80 million exit
- 30% ownership → about $67 million exit

This is why “I want a $100 million exit” is incomplete thinking. A $100 million exit puts $20 million in your hands only if you still own 20% and there are no other claims that change the distribution.
Dilution is real. Carta's 2026 founder ownership data shows that the median founding team retains about 56% of fully diluted equity at seed and 36% by Series A. Later rounds, option pools and secondary sales can reduce that further. Founder ownership therefore belongs in the operating dashboard from day one, not just in the cap table folder.
A unicorn is not created by hitting $100 million ARR
There is another shortcut founders use: “Get to $100 million ARR and you are a unicorn.” That is not a law either.
$100 million ARR is an extraordinary milestone—Bessemer calls companies that reach it “Centaurs”—but valuation depends on the multiple buyers or investors are willing to pay. Growth, gross margin, retention, market size, profitability and capital-market conditions all influence that multiple.
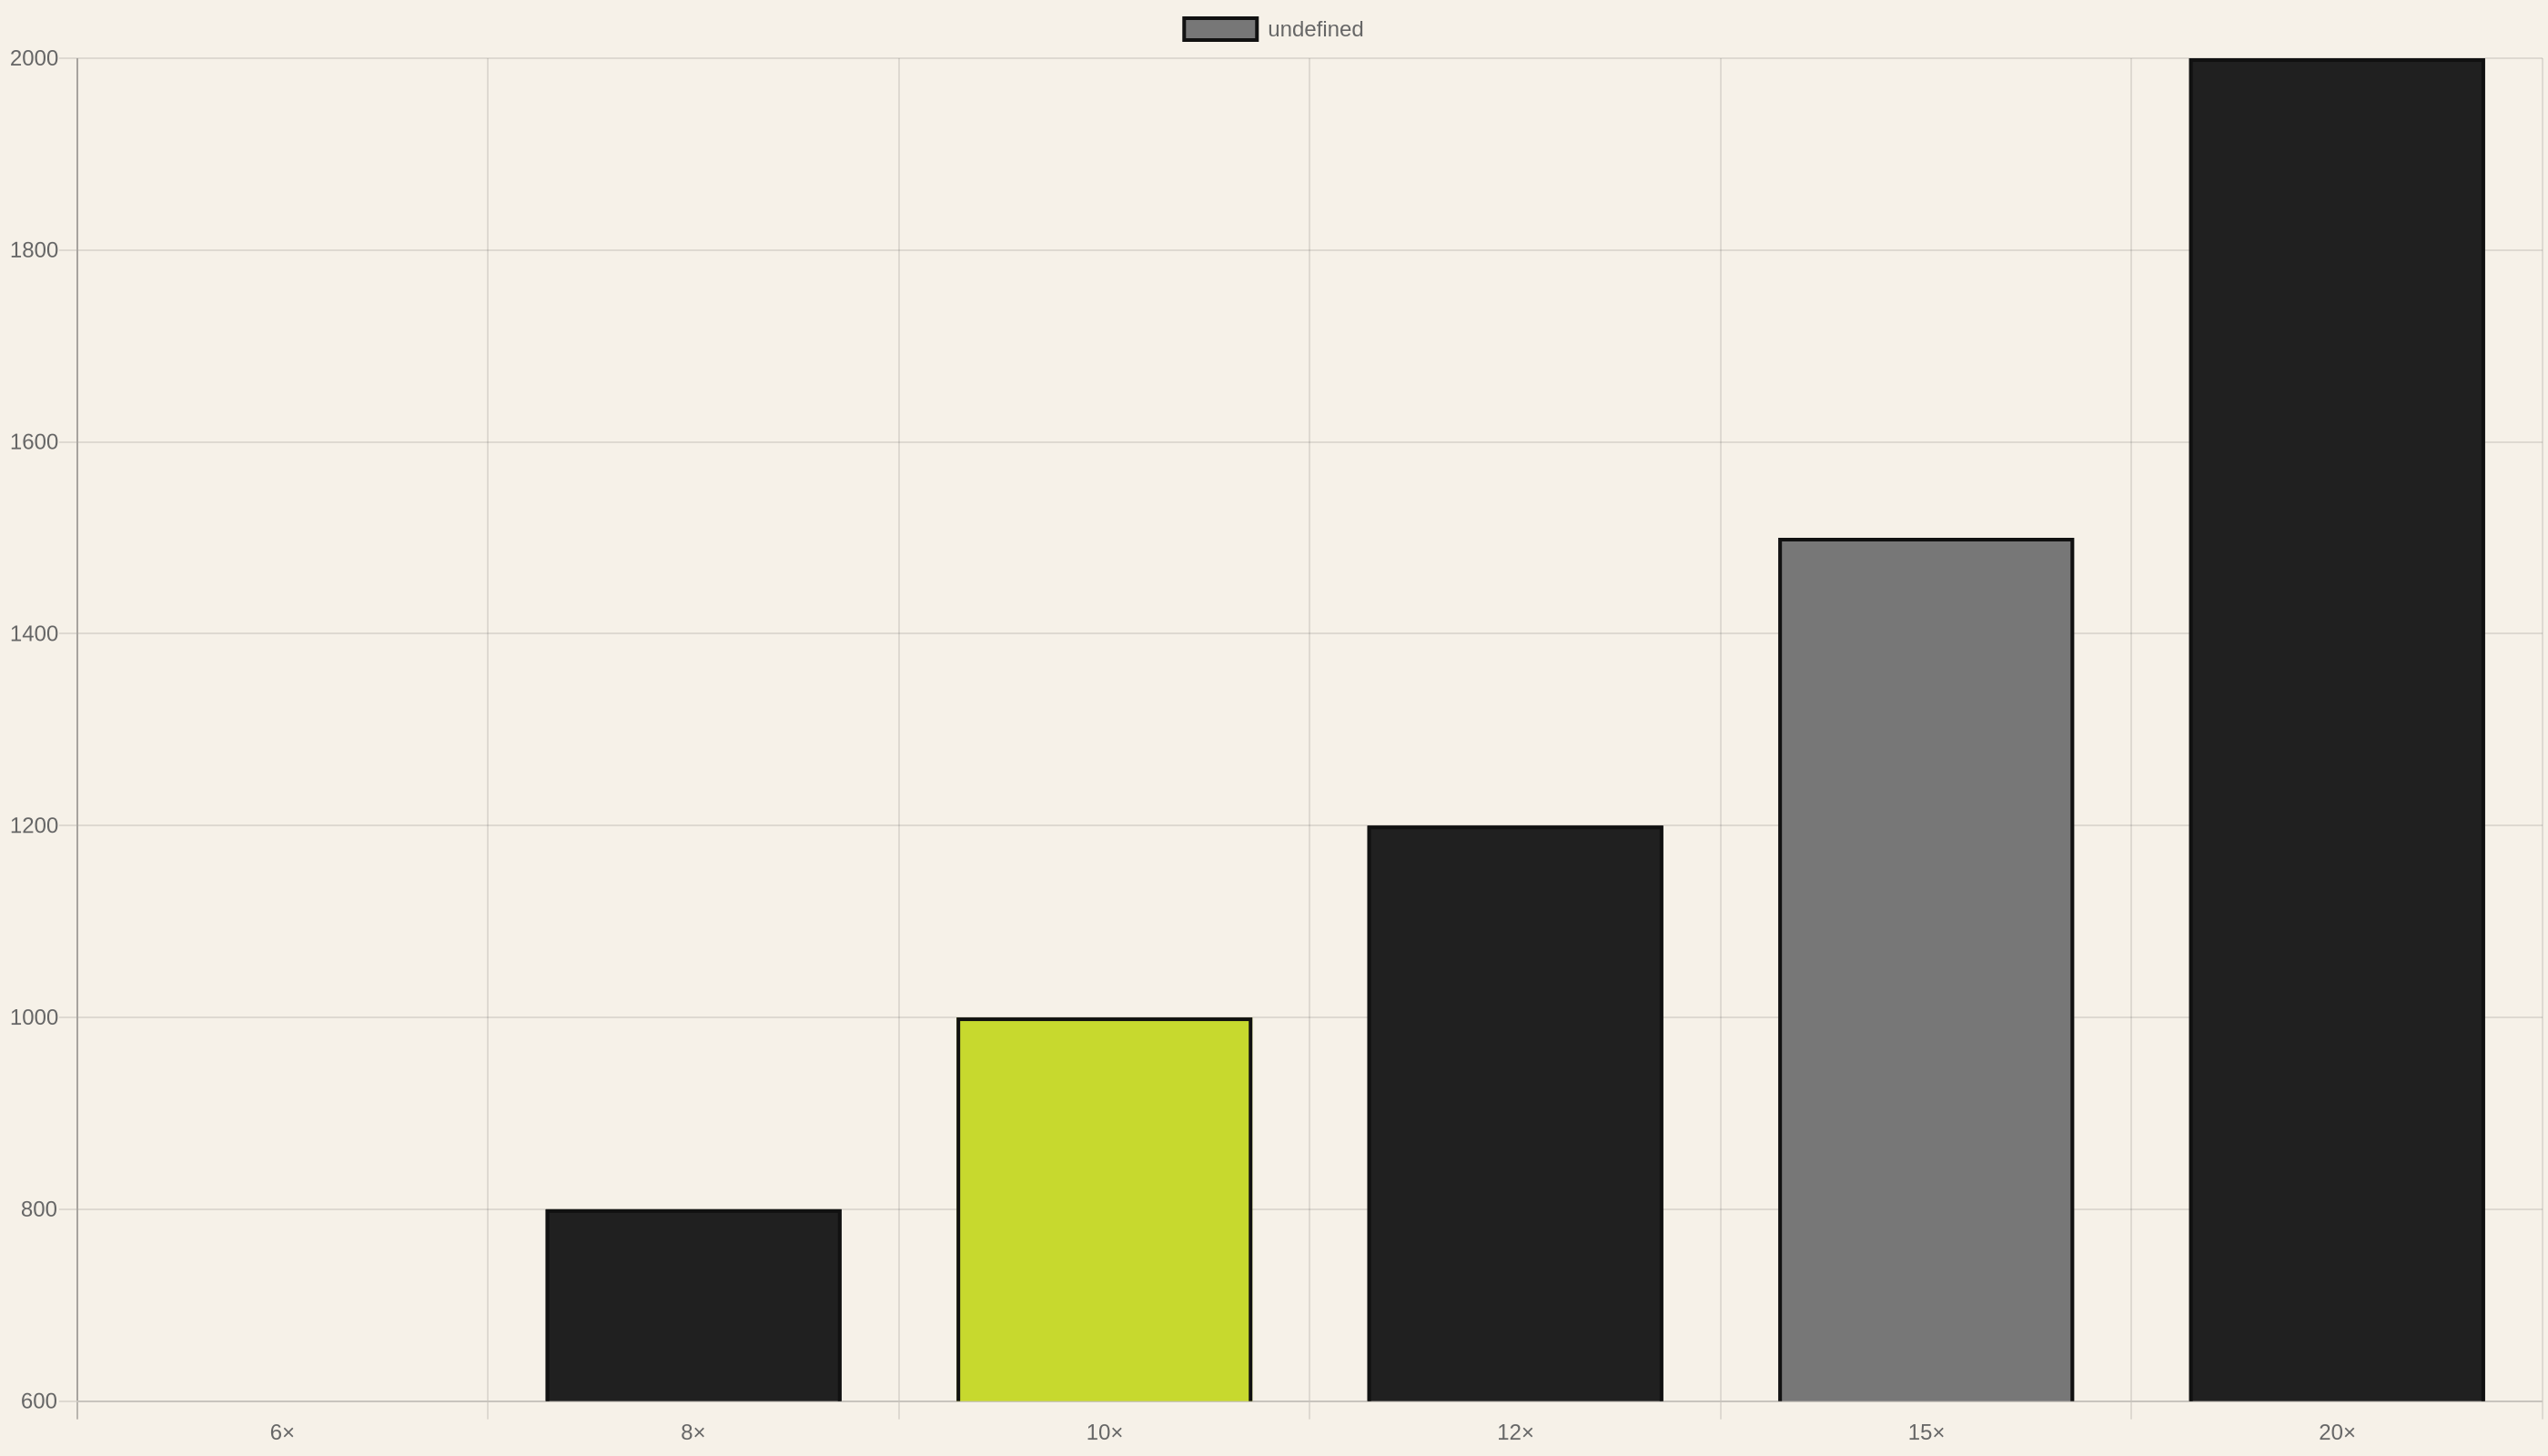
At an 8× revenue multiple, $100 million of ARR implies roughly $800 million of enterprise value. At 10×, it implies $1 billion. At 20×, it implies $2 billion.
So use $100 million ARR as a scale target, not as a magic valuation switch.
The $100 million ARR customer math
Once you choose the revenue target, the next question is brutally simple: how many customers do you need?
- $10 million annual contract value → 10 customers
- $1 million ACV → 100 customers
- $100,000 ACV → 1,000 customers
- $10,000 ACV → 10,000 customers
- $1,000 ACV → 100,000 customers
- $20 per month, or $240 per year → about 416,667 paying customers
Now ask the question founders usually skip
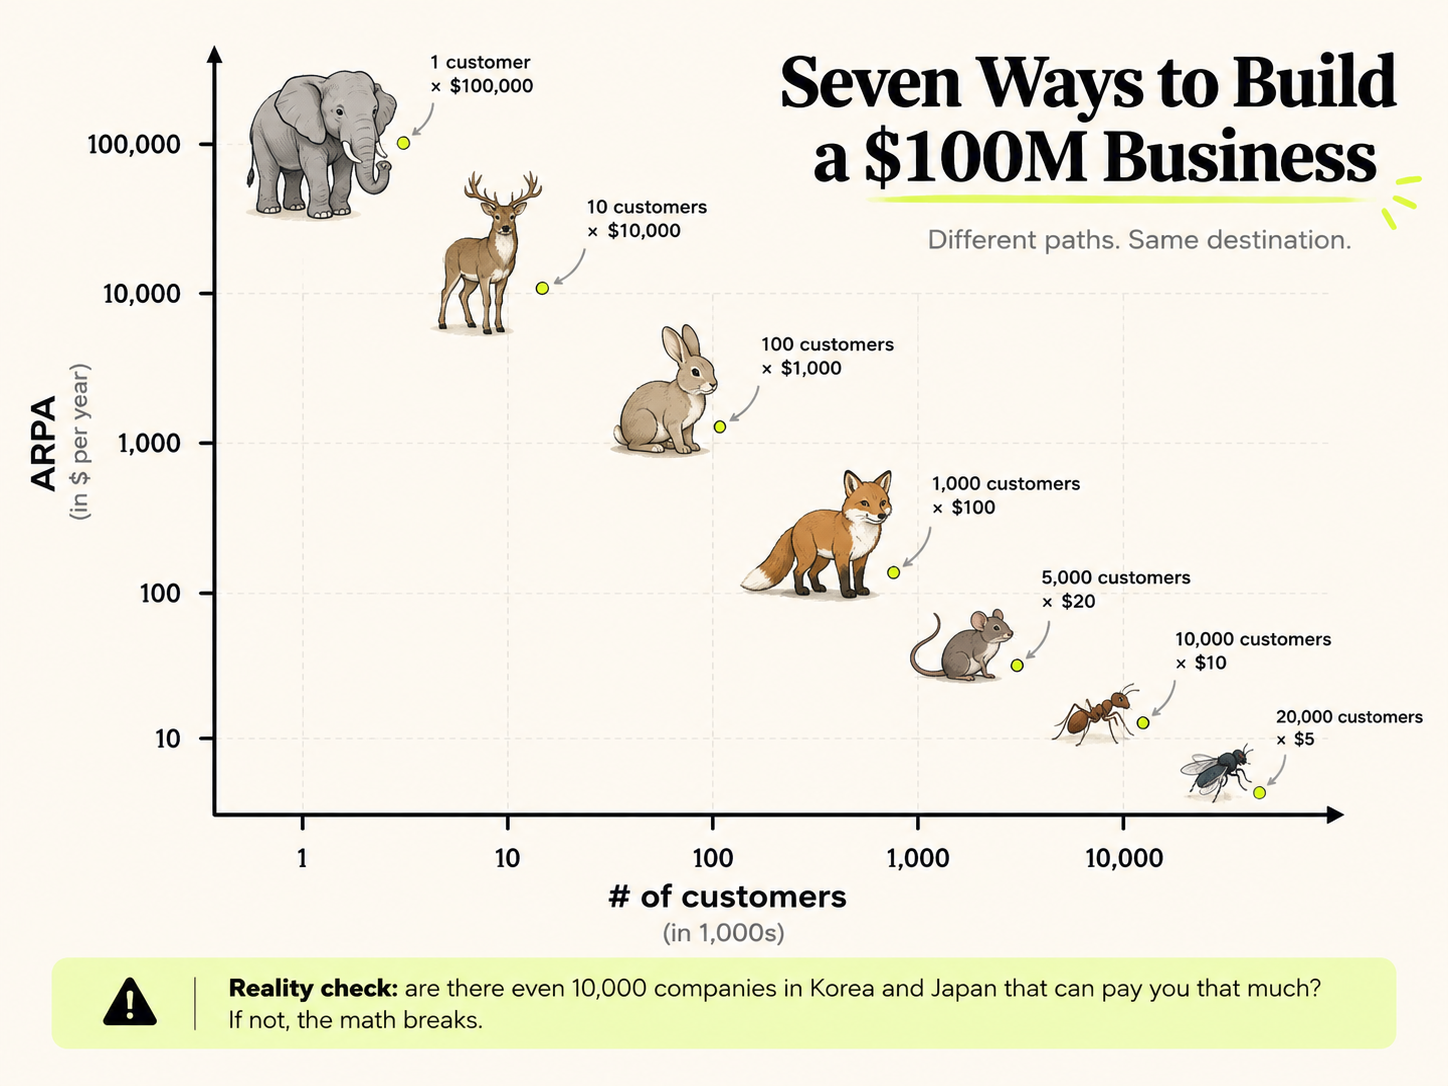
The chart is where the math starts to become uncomfortable.
Say your model requires 10,000 customers. Fine. Now ask: are there actually 10,000 companies in Korea and Japan that can buy this product at this price?
If you are selling a $100,000-a-year enterprise product, the theoretical arithmetic might say you need 1,000 customers. But if your real addressable market only contains 300 qualified buyers—and half of them will never switch vendors—the spreadsheet is lying to you.
The equation is not just price × customers = revenue. It is price × customers who exist × customers you can actually reach × customers willing to buy = revenue.
That is where a lot of venture-scale ideas quietly stop being venture-scale.
This is where strategy becomes architecture.
A company selling ten $10 million contracts needs deep enterprise relationships, long procurement cycles, implementation capacity and probably concentration risk. A company selling hundreds of thousands of low-cost subscriptions needs distribution, onboarding, support automation, retention and massive top-of-funnel scale.
The mistake is choosing a product without choosing the revenue architecture required to produce the outcome.
The nine metrics that actually matter
Every founder should be able to put these nine numbers on one page and explain how they connect to the exit math.
- Revenue / ARR. What is the repeatable revenue base today?
- Growth rate. How quickly is that base expanding?
- Gross margin. How much revenue remains after the direct cost of delivering the product?
- Retention / NRR. Do customers stay, shrink or expand?
- CAC payback. How long does it take to recover the cost of acquiring a customer?
- Burn multiple / cash efficiency. How much cash is being consumed to create each dollar of new recurring revenue?
- Runway. How long can the company operate before it needs more capital?
- ACV and customer concentration. How many customers are required, and how dangerous is losing the largest ones?
- Founder ownership. If the company wins, how much of the outcome still belongs to the founders?
These are not all SaaS-only metrics. The exact expression changes by business model.
SaaS and AI software
Prioritize ARR, growth, NRR, gross margin, CAC payback and burn multiple. SaaS Capital's 2026 survey of more than 1,000 private B2B SaaS companies reported median growth of 22% across respondents; its bootstrapped $3 million–$20 million ARR cohort reported median NRR of 103% and GRR of 91%. Benchmarks are context, not targets.
Marketplaces
Replace pure ARR obsession with GMV, take rate, contribution margin, buyer repeat rate, seller retention and marketplace liquidity.
Consumer subscriptions
Track paid conversion, retention by cohort, ARPU, CAC, engagement and churn. Customer count becomes central because a low price point forces enormous distribution scale.
Hardware and industrial businesses
Track order backlog, gross margin, working capital, production capacity, utilization, warranty/service costs and capital intensity. Revenue quality matters differently when growth requires factories, inventory or equipment.
Services businesses
Track revenue, gross margin, utilization, repeat business, revenue per employee and customer concentration. Services can create significant cash flow, but they usually do not receive software valuation multiples unless the model becomes highly repeatable or productized.
Build the company from the outcome backwards
- Decide the amount of liquid capital that would materially change your life.
- Estimate the founder ownership you could realistically retain.
- Calculate the exit value required to create that liquidity.
- Estimate the revenue and valuation multiple required to justify that exit.
- Choose the customer price point and customer count capable of producing that revenue.
- Identify the nine operating metrics that determine whether that model is actually working.
- Only then ask whether you are willing to spend the next eight to ten years building it.
You may still choose to build the company even if the math says it will never become a unicorn. That is fine. Not every great company needs to be venture-scale.
But you should know the math before you give it a decade of your life.
The uncomfortable founder question
Ask yourself: If this company works exactly as planned, does the outcome actually get me where I want to go?
If the answer is no, change the business model, the market, the pricing, the ownership plan—or the goal.
Hope is not a capitalization strategy.




.svg)